Best practices for using dev tools to measure pagespeed performance during development.
How to use the dev tools and browser APIs to identify pagespeed issues.
Website performance measurement should occur locally in your dev environment. Browser development tools and JavaScript APIs will enable quick iteration without needing to rely on third-party websites or audit reports.
The specific concepts and metrics will be explained in detail in the relevant Core Concepts modules. This section provides a general overview.
We'll primarily use browser Dev Tools that speed up local development. On Windows Google Chrome, the hotkeys top open dev tools are ctrl + shift + i or command + shift + i on mac.
Simulate an Average User
When working in a local dev environment, network requests don't have latency that would be seen in a production environment (on a server). Additionally, your specific internet connection or workstation's hardware might not reflect the average user.
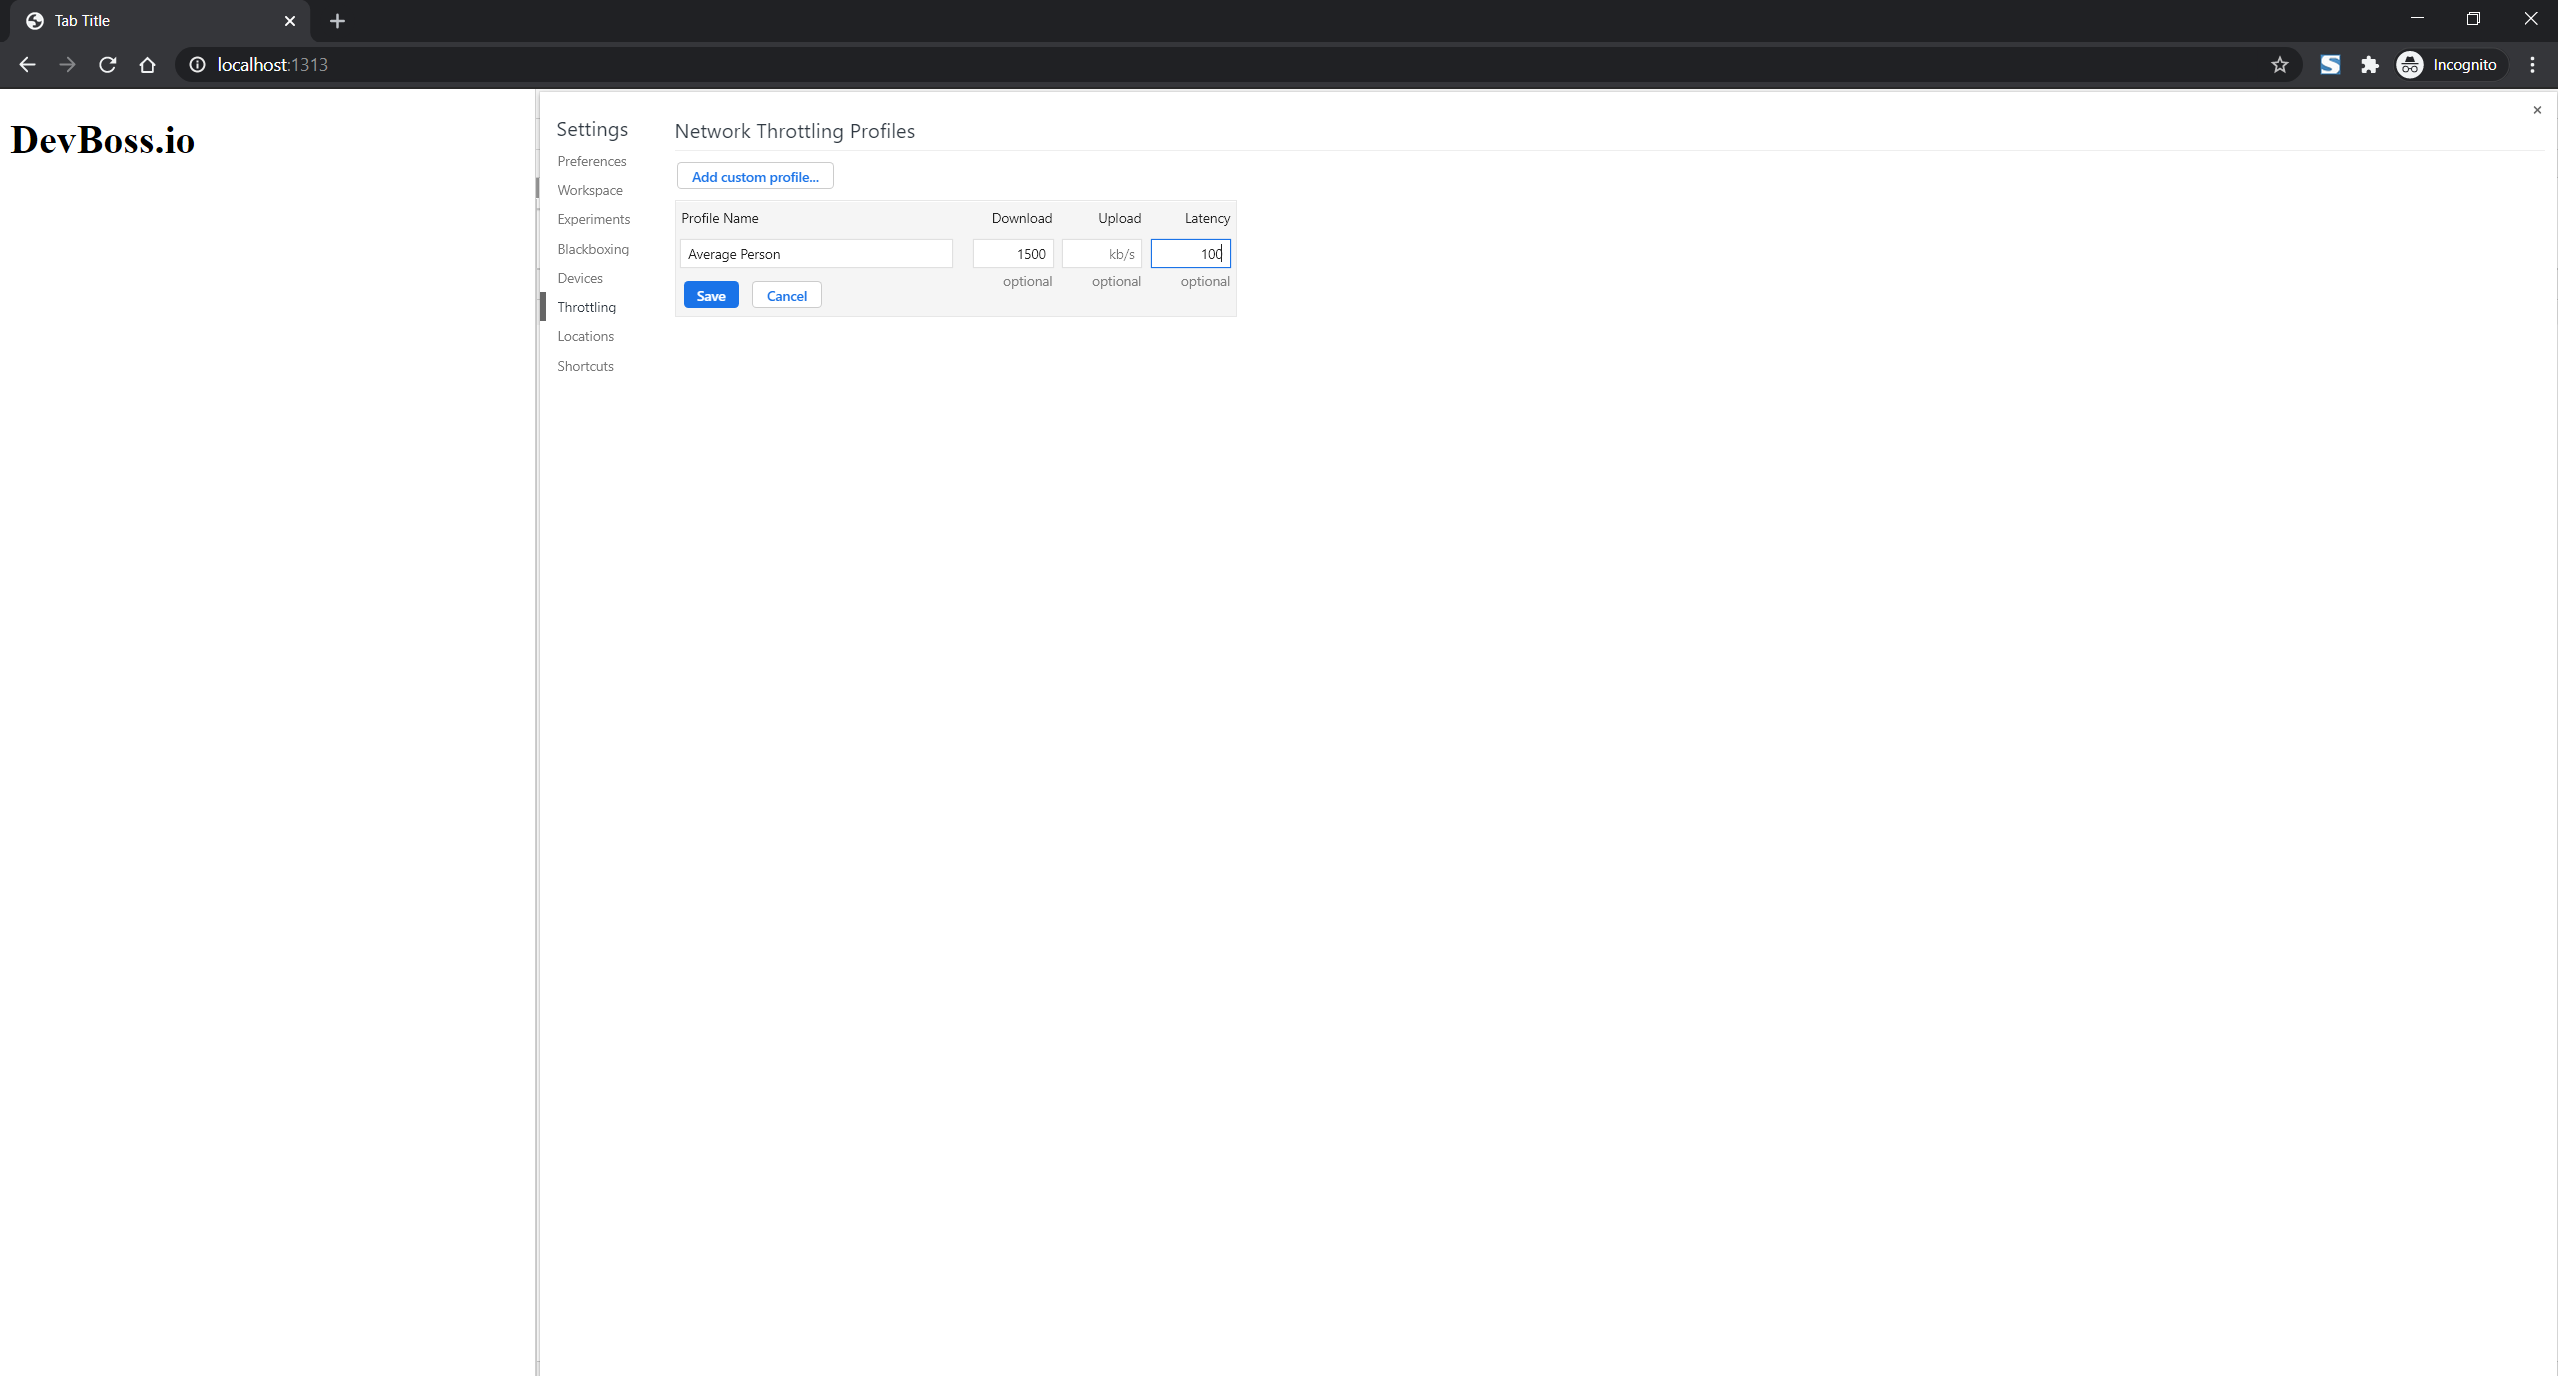
In the network tab, select the Online dropdown and click add.

Create a profile with a slower download speed and simulate network latency.
Disable Caching
When testing for performance, it's important to clear the browser cache when reloading. Otherwise, the browser will likely serve cached files, which won't provide an accurate picture of what the initial load speed is like.
It's easy to clear the page cache and refresh with CTRL + SHIFT + R or CMD + SHIFT + R. However, you can also configure dev tools to clear cache on reload.

Important Metrics at a Glance
The "network" tab in dev tools is an easy way to check a few key metrics without running a profiler.
Network Requests
Files downloaded by the browser appear on a timeline, allowing us to see the download time and order of resources.

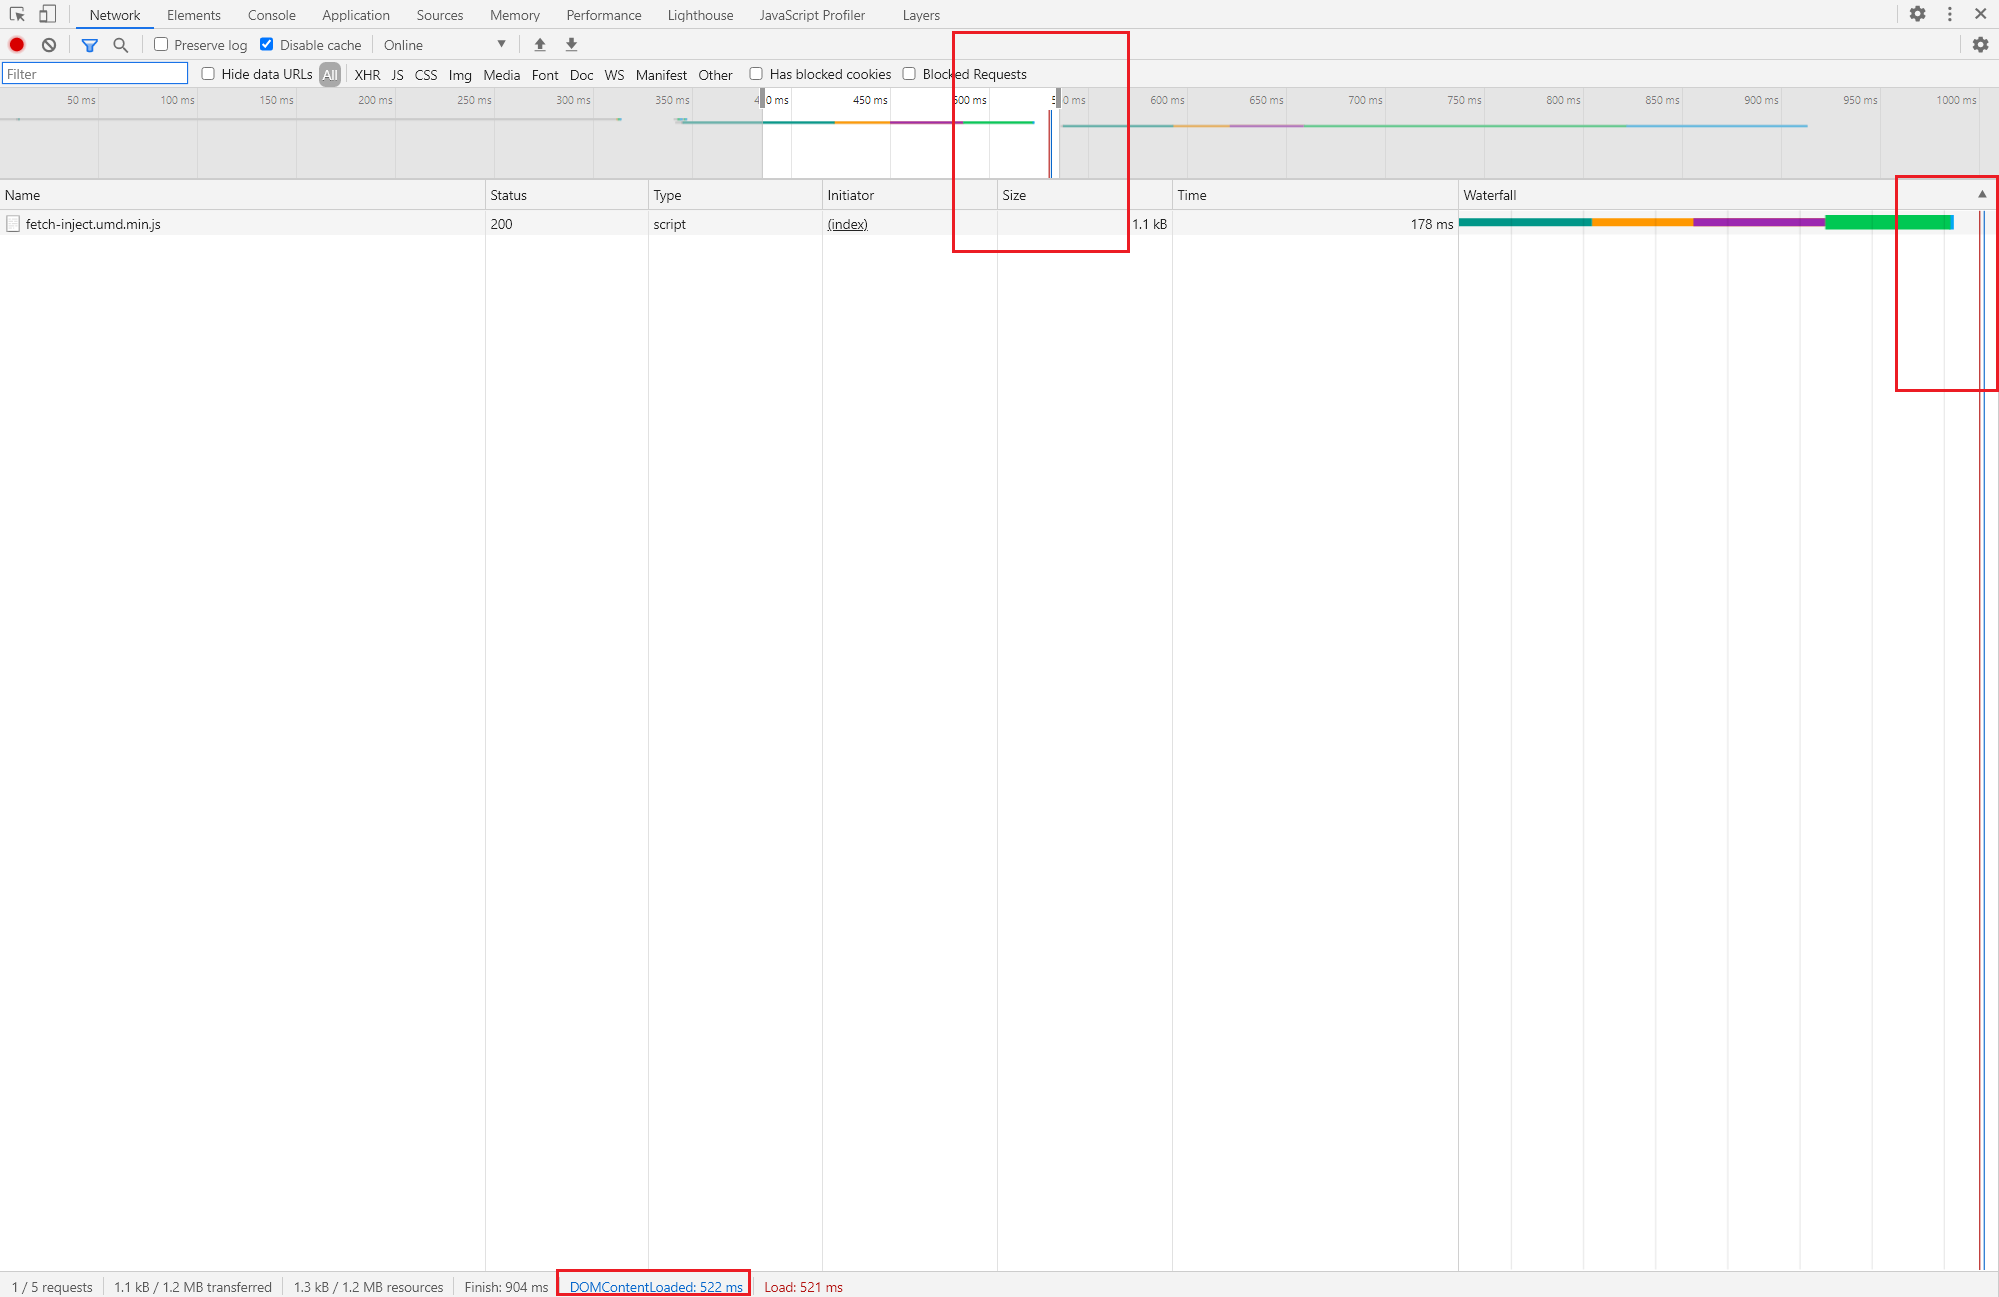
DOM Construction time
One of the first metrics we'll consistently check is how long it takes the HTML Parser to construct the DOM or Document object. In the network tab in dev tools, the blue DOMContentLoaded metric appears on the timeline at 124ms. This metric includes the download time of the HTML document + the HTML parser time.
Total load time
After all resources are downloaded and evaluated, we get the load metric.
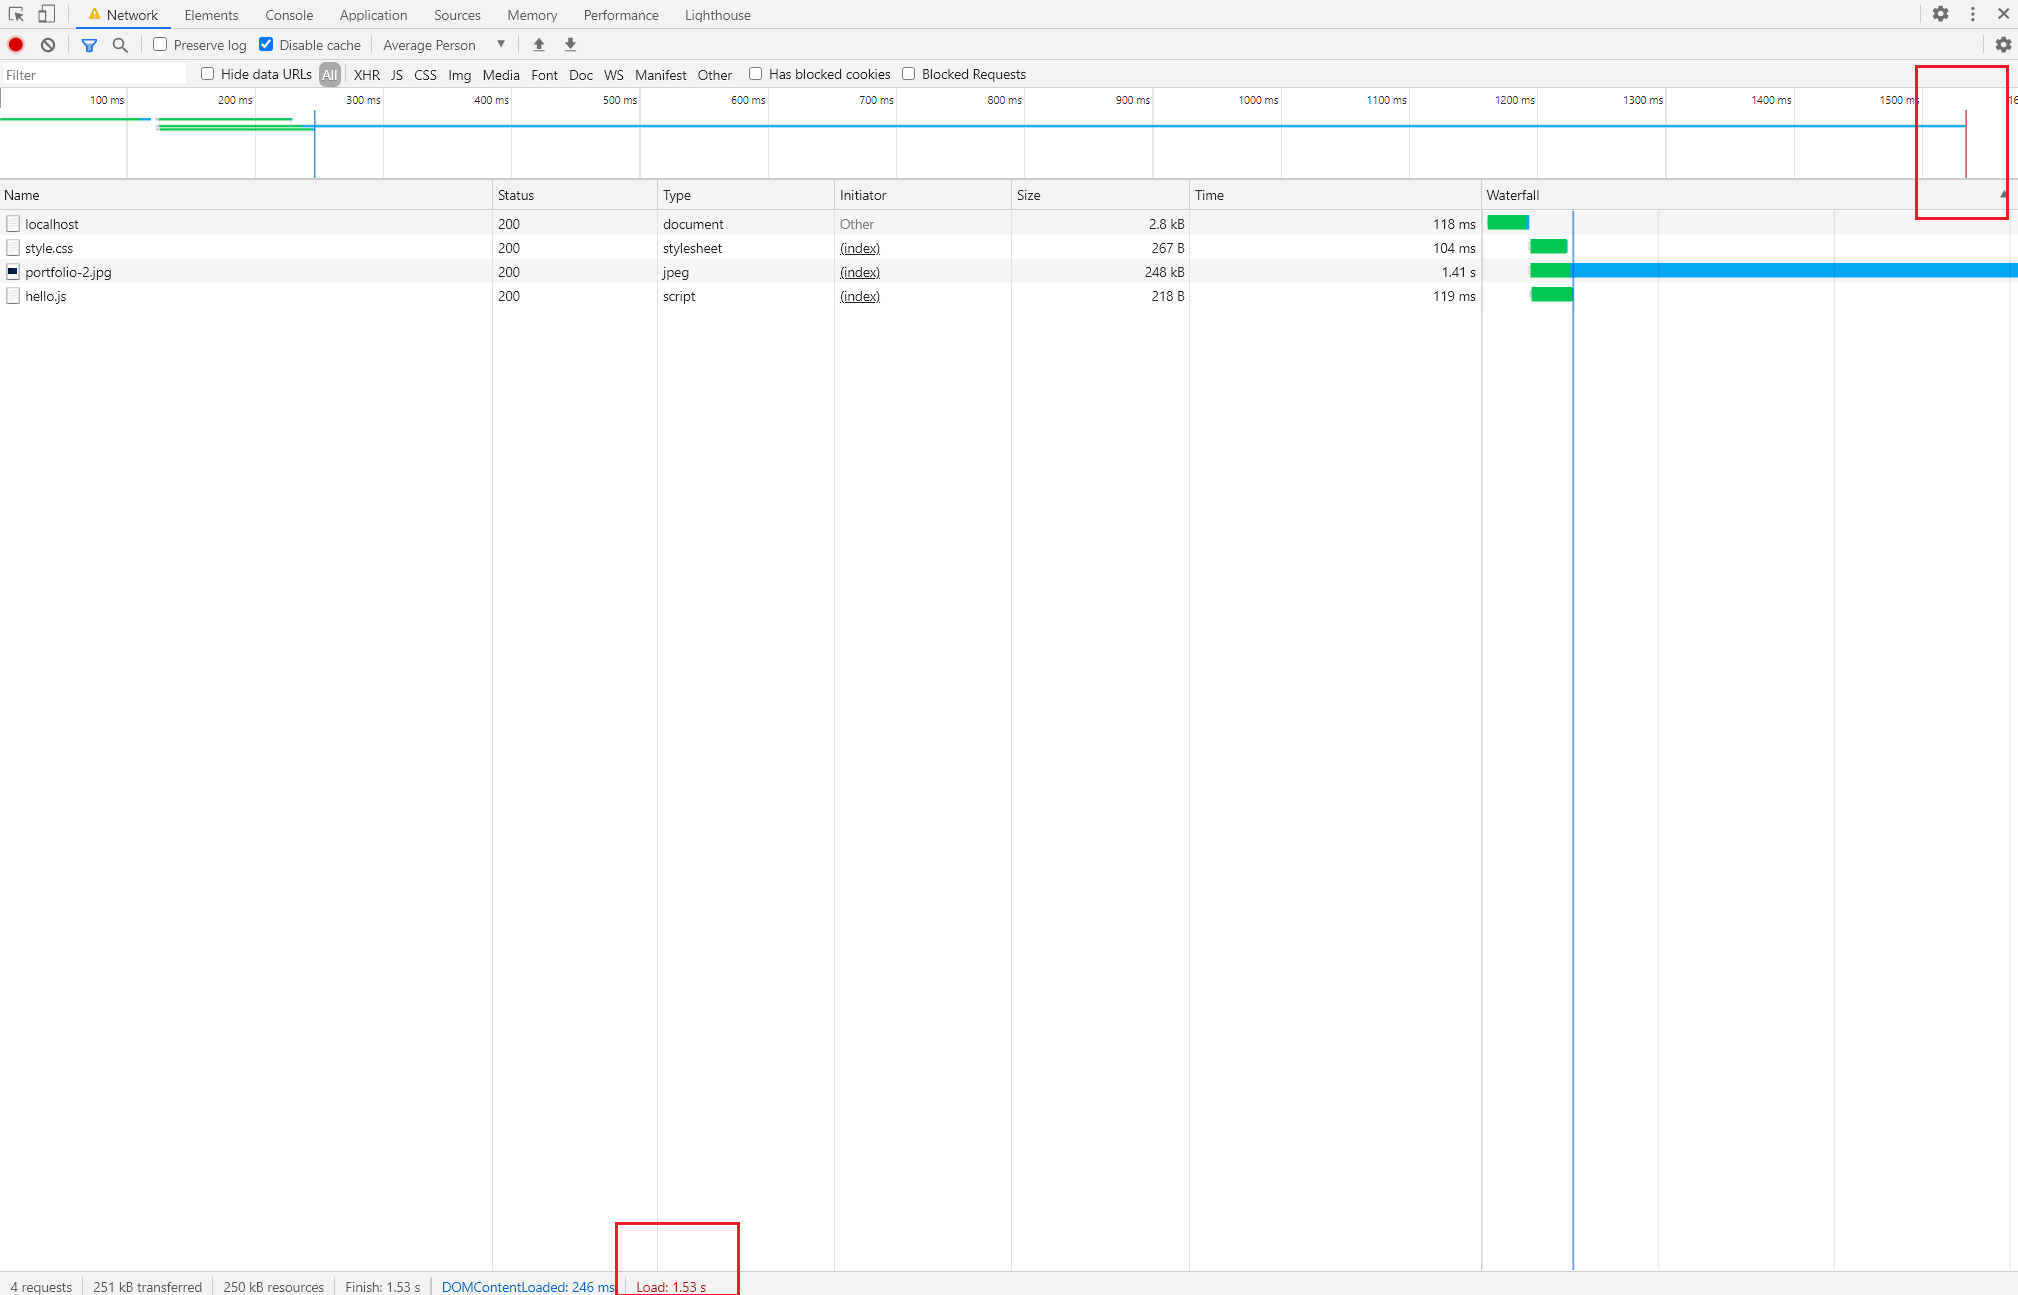
load is equal to DOMContentLoaded time + the download and evaluation time of all resources (including images).
Performance Profiler
The performance tab can be used to examine more metrics related to the visual rendering process and the activity on the main thread.
Clicking the reload button will refresh the page and record the performance.
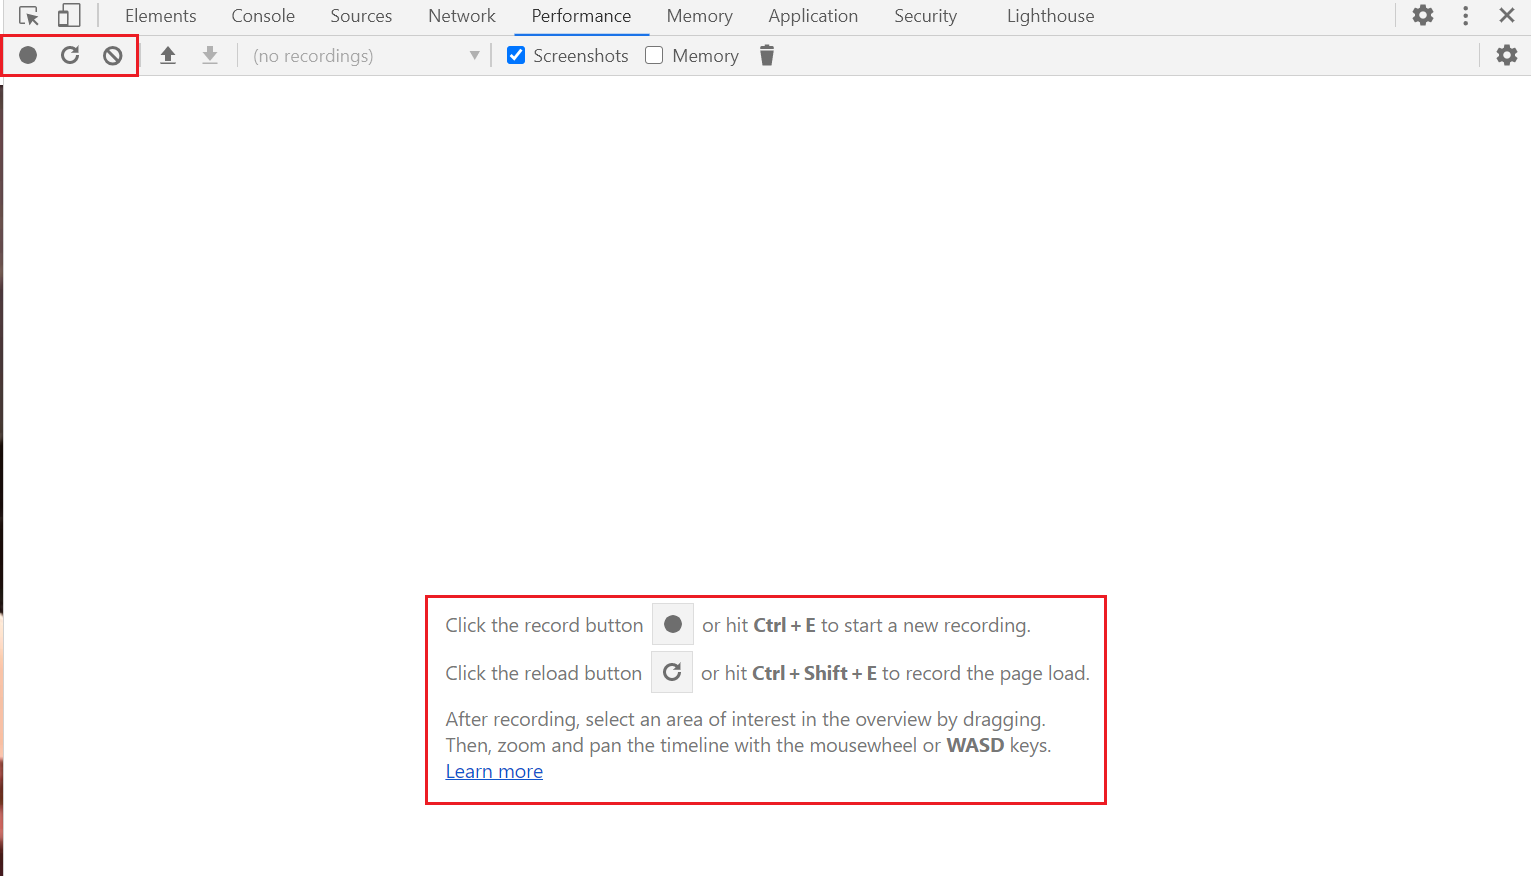
The Performance timeline allows us see what the page looks like at specific points during the rendering process with screenshots overlayed on the timeline.

The profiler uses the black line to show the start of the current profiling session.
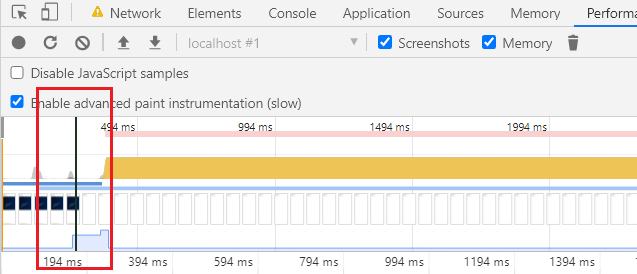
Profiler Annotations/Metrics
Various metrics are annotated on the timeline. The order of these annotations on the timeline can vary depending on how the HTML is structured and optimized.
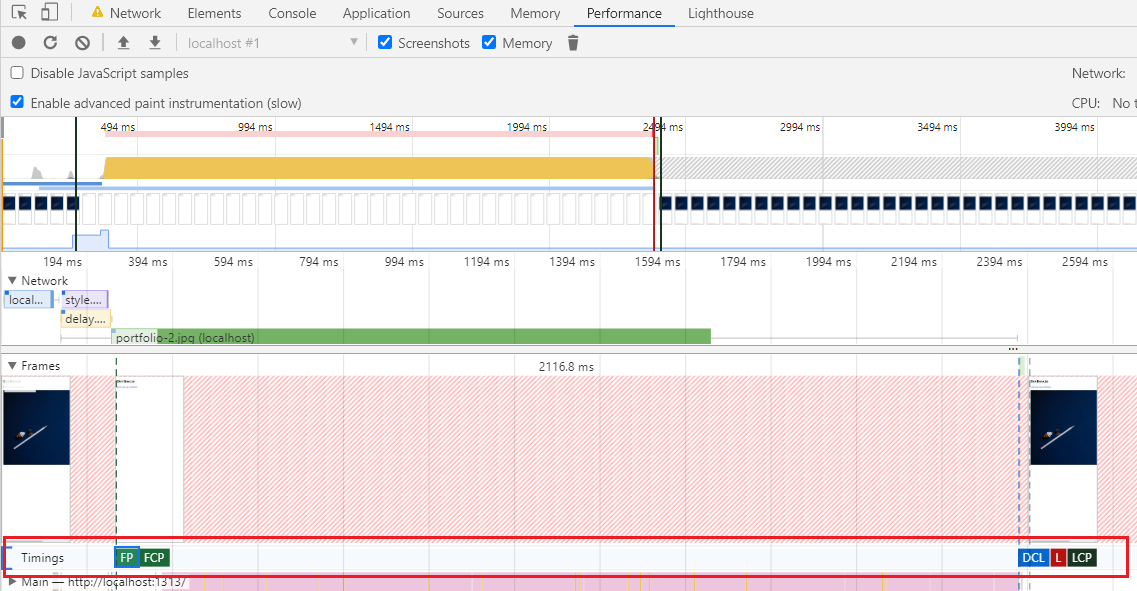
- FP (first paint): the start of the visual rendering process - when the browser actually starts the process of displaying pixels
- FCP (first content paintful): when the user is able to see any visual rendering of our HTML.
- LCP (largest content paintful): when the browser-determined largest element at the top portion of the page is displayed to the user.
- DCL (DOM Content Loaded): when the DOM Parser finishes constructing the
Documentobject.
Profiling Main Thread Tasks
The profiler provides information about tasks the browser is performing via the "main" row.
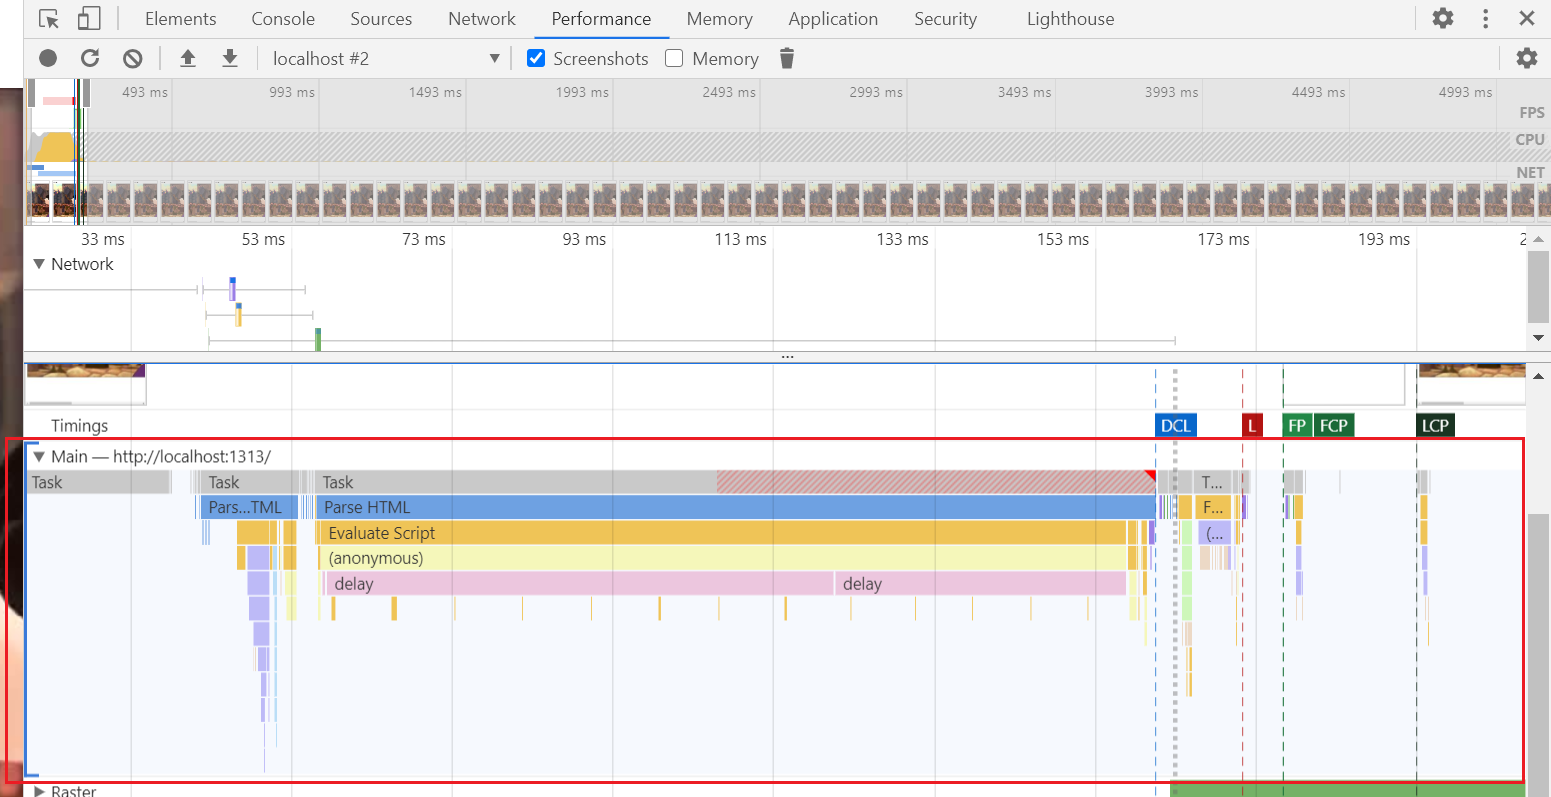 Task order and timing occur from left to right. The actions within each task are displayed in each row below the generic "task" heading.
Profiling Tasks after Load
Important: When running the profiler, some tasks run on the timeline passively.- If you run the profiler, but do not move your mouse over the screen, no tasks appear on the timeline.
- If you run the profiler, but mover your mouse over the content area, the timeline will have short tasks related to the mouse moving around.
It's useful to use named functions to more easily identify tasks you are testing for on the timeline.
Benchmarking DOM Construction with MutationObserver
JavaScript APIs can give us a more precise look at performance and also help us understand what goes into pagespeed metrics. The MutationObserver API can be used to track how long it takes for the HTML Parser to parse individual HTML nodes.
You don't need to know how these APIs work or have an in-depth understanding of JS. Implementing these are optional and it's not a requirement for pagespeed optimization.
We can console.log every time the HTML parser discovers an element and attaches it to the DOM.
// Timestamp to compare to
const startTime = new Date();
// Timestamp for each node
var lastNodeTime = new Date();

// Initialize the observer
var observer = new MutationObserver(function(mutations){
  for (var i=0; i < mutations.length; i++){
    for (var j=0; j < mutations[i].addedNodes.length; j++){
      // Pass the newly attached node to a callback function
      checkNode(mutations[i].addedNodes[j]);
    }
  }
});

// Watch for changes to an element (like childNodes being added)
// Attach the observer to the root HTML node (<html>) via the first argument
// Pass options to the second argument, such as watching changes to nested nodes
observer.observe(document.documentElement, {
  childList: true,
  subtree: true
});

let checkNode = function(addedNode) {
  if (addedNode.outerHTML) {
    // Create a formatted table with the node HTML, time difference, and timestamp.
    console.table({
      "Node HTML": addedNode.outerHTML,
      // How long this node took to add to the DOM
      "Time Since Last Node Added": new Date() - lastNodeTime,
      "Added At": new Date() - startTime
    })
    // Reset timestamp
    lastNodeTime = new Date();
  }
}
// Optionally, log when DCL occurs (last childNode is added)
document.addEventListener("DOMContentLoaded", () => {
  console.log("DOMContentLoaded Event Fired in", new Date() - startTime)
  observer.disconnect();
})
Using PerformanceObserver for Network Request Profiling
Using the PerformanceObserver API at the top of our HTML file, we can console.log more specific details about network requests and general page performance.
let results = {};
var performance_observer = new PerformanceObserver(list => {
  list.getEntries().forEach(entry => {
    // Display each reported measurement on console
    console.log(entry)
    results[entry.name] = {
      "start": entry.startTime,
      "duration": entry.duration
    }
    console.table(results)
  })
});
performance_observer.observe({entryTypes: ['frame', 'navigation', 'resource', 'mark', 'measure']});
performance.mark('registered-observer');
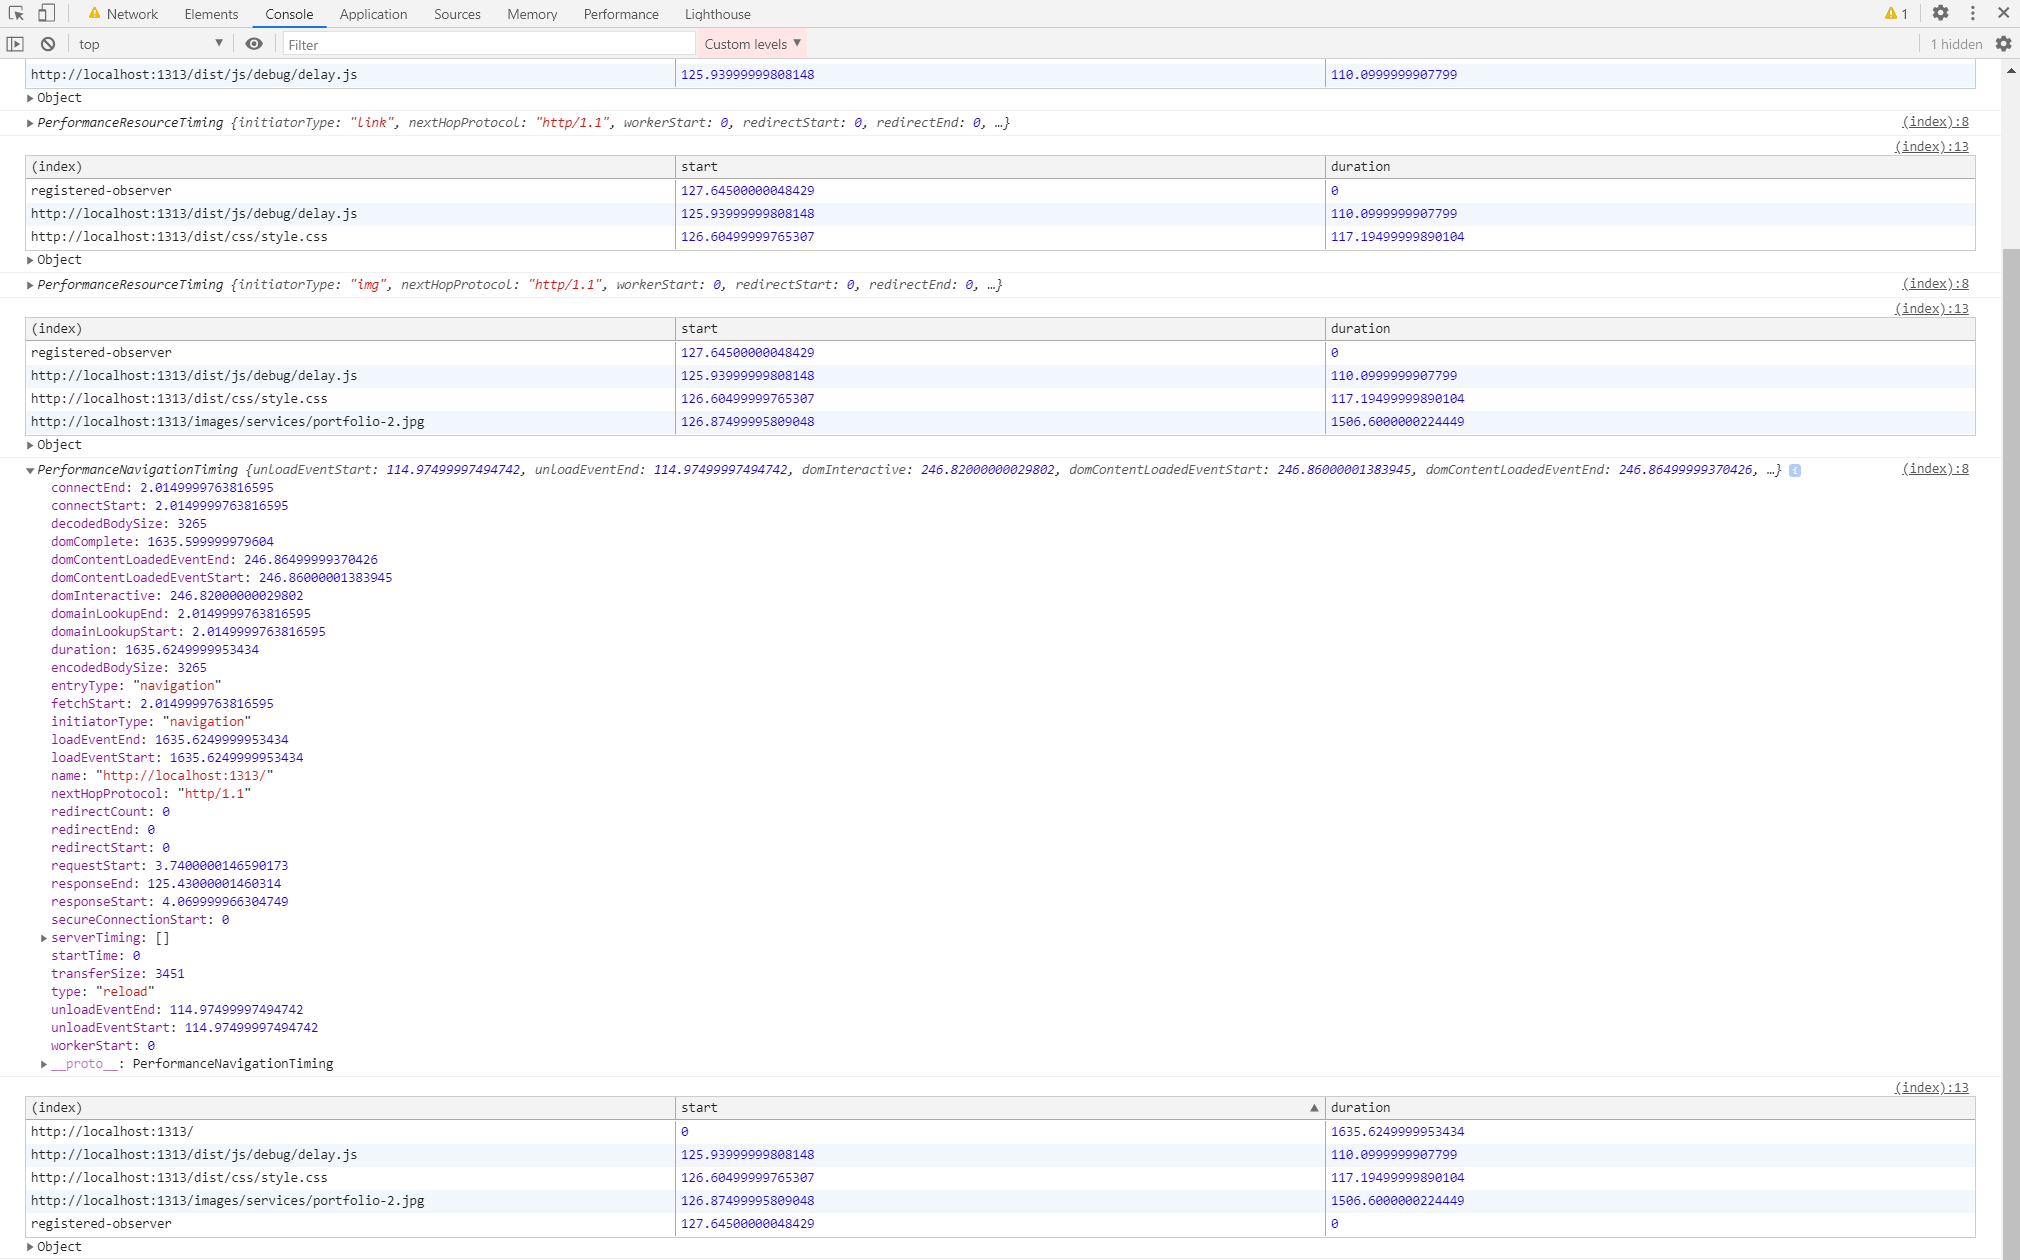
Many of these metrics are displayed in devtools, but this gives us more control over our profiling.
Tracking JS Execution Time with Both APIs
With the previous MutationObserver setup, we can even see how long JavaScript pauses DOM Construction by examining the timestamps that we setup.
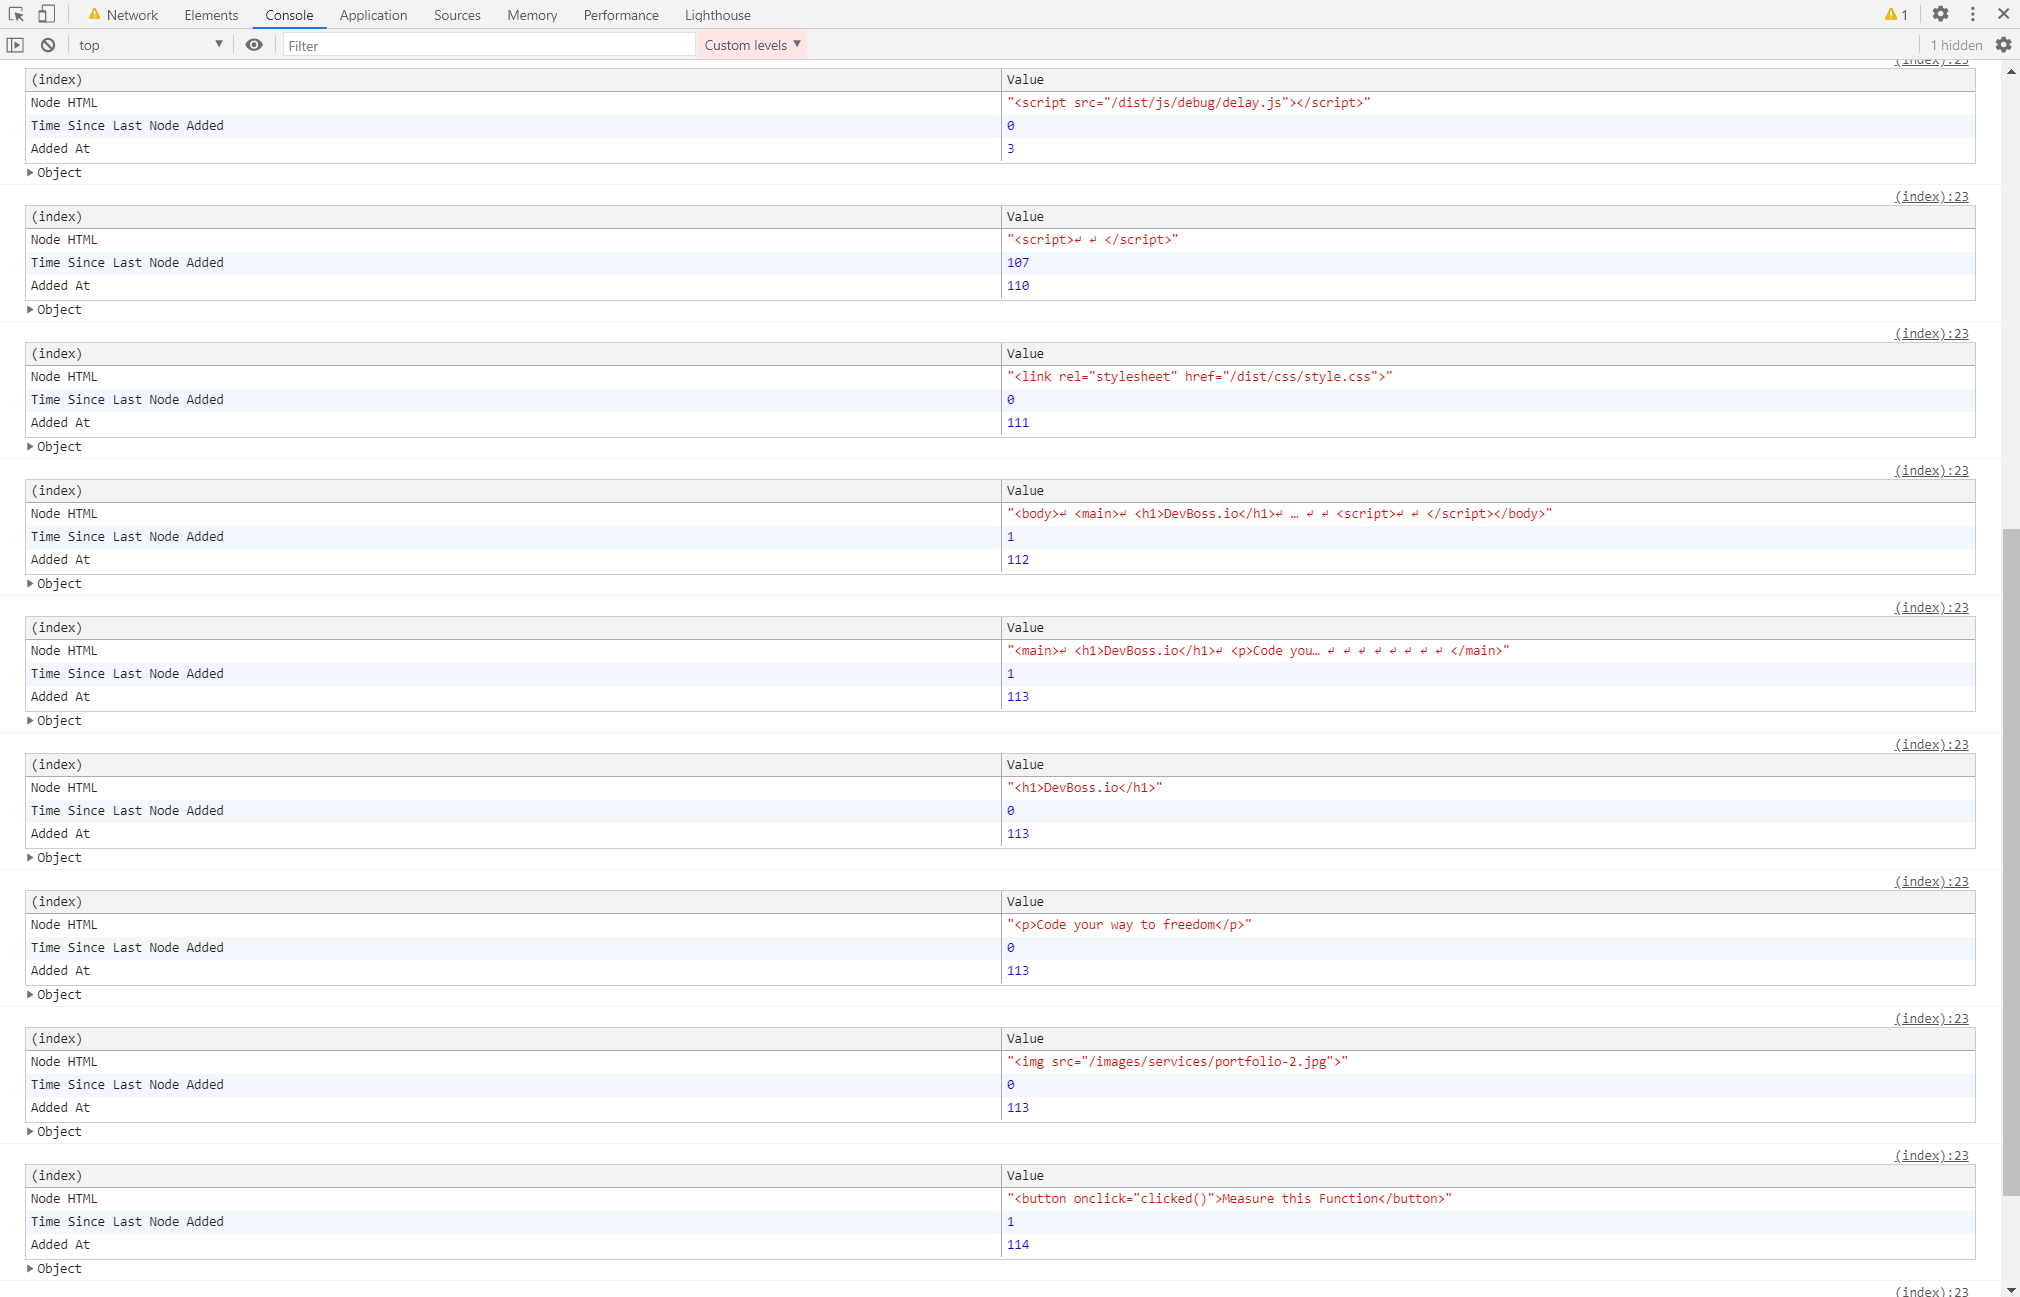 Here we can see that the
 delay() function caused about a 100ms delay in DOM construction because of the "Time Since Last Node Added" metric that is console logged after it.
We can also use PerformanceObserver to set timestamp markers that allow us to benchmark specific parts of our code.
function clicked(elem) {
  console.log("Clicked")
  performance.mark('click-function-start');
  // This function takes 3 seconds to run
  delay(3000)
  performance.mark('click-function-end');
  performance.measure('delay', 'click-function-start', 'click-function-end');
}
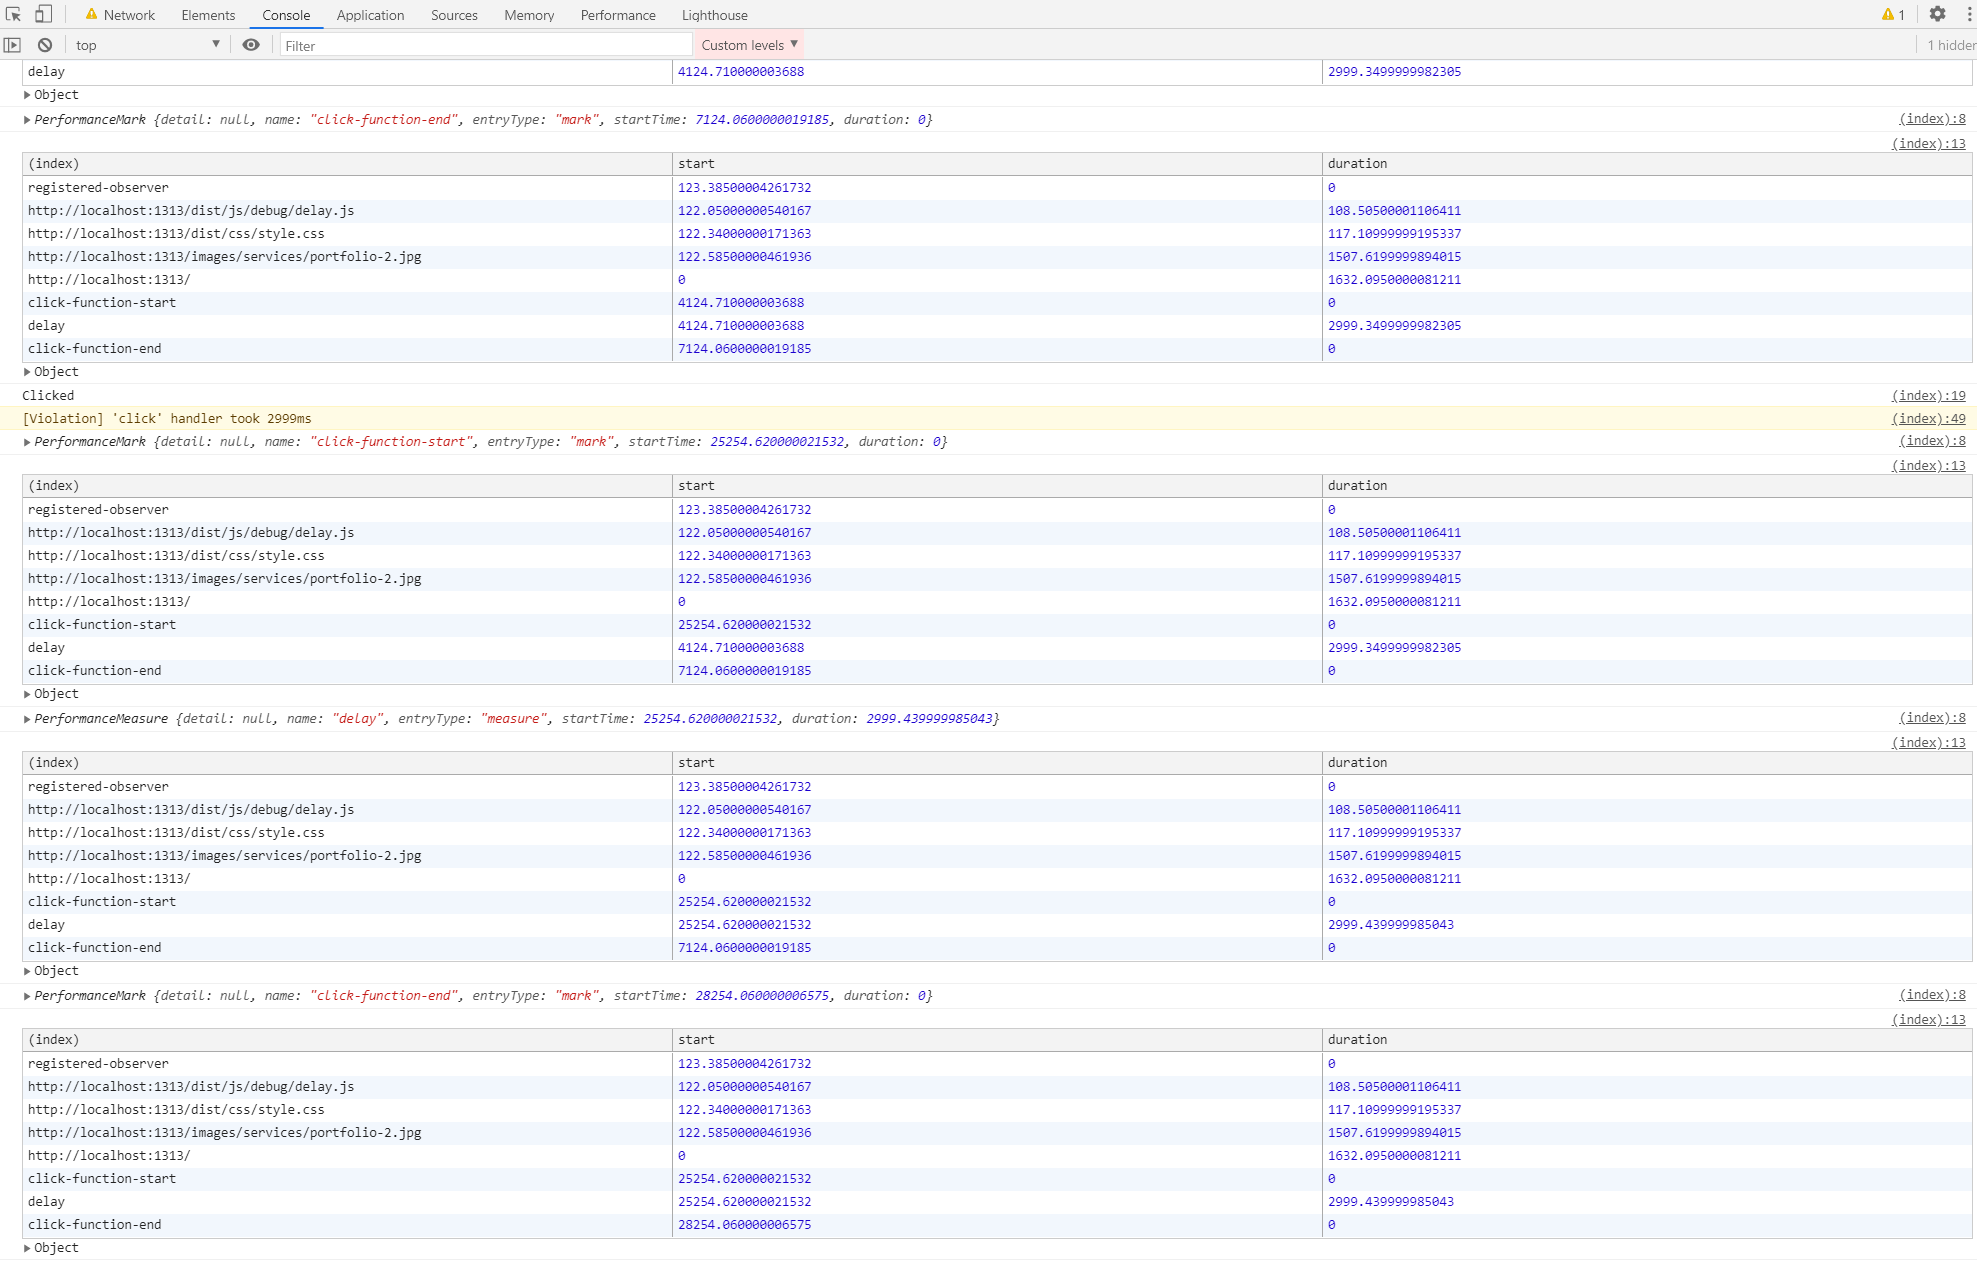 In this case, the
 clicked() function called by the click event takes 3 seconds to finish.
